Tutorial: customer segmentation with fuzzy clustering
Crisp k-means forces every customer into exactly one segment. Fuzzy c-means instead gives each customer a graded membership in every segment — useful when boundaries are blurry. This tutorial segments a 2-D dataset and uses validity indices to choose how many segments there really are.
1. Get some 2-D data
We use the bundled make_blobs helper; in practice these would be two scaled
features (say monthly spend and tenure):
import fuzzytool as fz
from fuzzytool import cluster
from fuzzytool.datasets import make_blobs

X = make_blobs(centers=((2, 2), (8, 7), (3, 8)), n_per=70, spread=0.9, seed=1)
2. How many segments? Sweep c
Run the algorithm for a range of cluster counts and compare two internal validity indices: the partition coefficient (higher = crisper) and Xie-Beni (lower = better):
for c in range(2, 6):
    res = fz.fuzzy_cmeans(X, c=c, m=2.0, seed=0)
    pc = cluster.partition_coefficient(res.u)
    xb = cluster.xie_beni(X, res.centers, res.u)
    print(f"c={c}: PC={pc:.3f}  XB={xb:.3f}")
c=2: PC=0.826  XB=0.115
c=3: PC=0.884  XB=0.045   <- best: highest PC, lowest XB
c=4: PC=0.780  XB=0.450
c=5: PC=0.684  XB=0.627
c=3 maximizes the partition coefficient and minimizes Xie-Beni, so three
segments is the natural choice.
3. Fit and inspect the chosen model
res = fz.fuzzy_cmeans(X, c=3, m=2.0, seed=0)

res.centers   # (3, 2) segment prototypes
res.u         # (3, n) membership matrix, columns sum to 1
res.labels    # hard assignment (argmax over u), handy for coloring
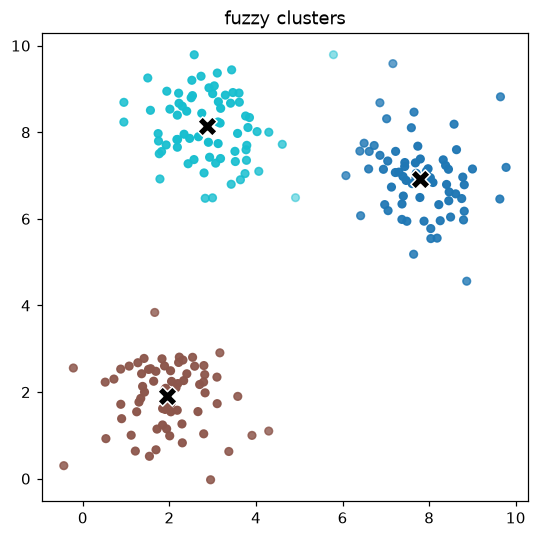
4. Visualize the segments
Point opacity encodes the top membership, so customers on a boundary between two segments appear fainter:
Where to go next
- Try
gustafson_kesselfor elongated (ellipsoidal) segments, orpossibilistic_cmeanswhen the data has outliers — see Fuzzy clustering. - Feed the learned memberships into a fuzzy rule base as soft features.